Brier score explained in plain words
By insiderz8 min read
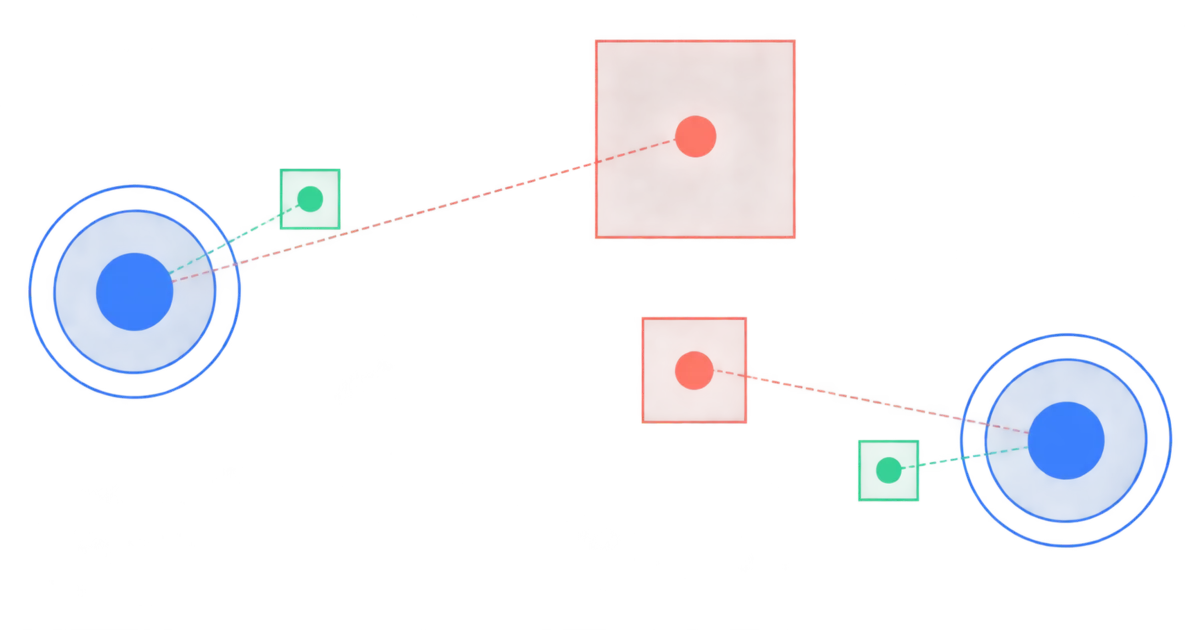
A Brier score measures how far your probabilities were from reality. For each forecast, take the probability you gave, subtract the outcome written as 1 for happened and 0 for did not, and square the result. Average that over all your forecasts. Zero is perfect, 0.25 is what you get by saying 50 percent every time, and 1 is as wrong as it is possible to be.
What is a Brier score, in one sentence and one example?
In one sentence: a Brier score is the average squared error of a probability forecast, where the outcome counts as 1 or 0.
In one example: you say a candidate has a 70 percent chance of winning, and the candidate wins. Your error on that forecast is 1 minus 0.70, which is 0.30. Squared, that is 0.09. If that were your only forecast, your Brier score would be 0.09.
The score comes from meteorology. Glenn Brier proposed it in Verification of Forecasts Expressed in Terms of Probability, published in Monthly Weather Review in January 1950, to grade rain forecasts. It has been the default accuracy measure for probability forecasts ever since.
What is the formula?
The formula, once: Brier score equals the average of (p minus o) squared, where p is your probability between 0 and 1 and o is 1 if the event happened and 0 if it did not.
There is one trap worth knowing. Brier's original 1950 definition sums the squared error over every possible outcome, so for a yes or no question it adds the error on "yes" and the error on "no" and runs from 0 to 2. The version almost everyone uses today for yes or no questions counts only one side and runs from 0 to 1. The two differ by a factor of two. Mellers and colleagues used the 0 to 2 version in their 2015 paper on superforecasters, so a score from that literature is not directly comparable to a score of 0.096 from a modern binary benchmark. Always check which version a number uses before you compare it to yours.
A worked example
Five calls, five outcomes, one score. The outcome column is 1 for happened and 0 for did not.
| Call | Your probability | Outcome | Error | Squared error |
|---|---|---|---|---|
| Incumbent wins re-election | 0.85 | 1 | 0.15 | 0.0225 |
| Bill passes before December | 0.60 | 0 | 0.60 | 0.3600 |
| Rate cut at the next meeting | 0.30 | 0 | 0.30 | 0.0900 |
| Team qualifies | 0.95 | 1 | 0.05 | 0.0025 |
| Merger closes this quarter | 0.40 | 1 | 0.60 | 0.3600 |
The squared errors add up to 0.835. Divided by five calls, the Brier score is 0.167. The two calls that hurt are the ones where you were confident on the wrong side, and that is the point of squaring: being 60 percent wrong costs you sixteen times what being 15 percent wrong costs.
These numbers are a worked example, not real calls.
Why is 0.25 the number to remember?
0.25 is the score you get by saying 50 percent on everything, forever. The error is always 0.5, and 0.5 squared is 0.25. It does not matter what happens, and it does not matter how hard the questions are.
That makes 0.25 the line between saying something and saying nothing. A score above 0.25 means your probabilities were worse than useless: you would have done better by refusing to answer. A score below 0.25 means you carried information. How far below is the only interesting question.
What is a good Brier score?
There is no universal good score, because the score depends on the questions. A forecaster who only calls near certainties will beat a forecaster who takes on genuinely uncertain events, and the second one is more useful. Any Brier score quoted without its question set is not a fact, it is decoration.
With that said, here are anchors from published benchmarks, each with its question set and date.
| Forecaster or rule | Brier score | Question set | Date |
|---|---|---|---|
| Perfect forecaster | 0.000 | any | definitional |
| Superforecaster median, market questions | 0.074 | ForecastBench, N=76 | human forecasts collected July 2024 |
| Superforecaster median, overall | 0.096 | ForecastBench, N=498 | human forecasts collected July 2024 |
| Public median, overall | 0.121 | ForecastBench, N=498 | human forecasts collected July 2024 |
| Best language model (Claude 3.5 Sonnet) | 0.122 | ForecastBench, N=498 | human forecasts collected July 2024 |
| Saying 50 percent on everything | 0.250 | any | definitional |
| Maximally wrong forecaster | 1.000 | any | definitional |
The four benchmark rows come from ForecastBench, a dynamic forecasting benchmark published at ICLR 2025 by Ezra Karger, Philip Tetlock and co-authors. The human comparison groups were surveyed in July 2024. On that set, superforecasters beat both the general public and the best language model at p below 0.001.
Notice how much lower the market-question score is than the overall score for the same people: 0.074 against 0.096. Questions drawn from live prediction markets were easier for everybody, which is exactly why you cannot read a raw Brier score as a skill level.
Why can you not game it by saying 50 percent?
Because the Brier score is a proper scoring rule. That means your expected score is best when you report the probability you actually believe. If you truly think something is 80 percent likely and you write 65 percent to look cautious, your expected Brier score gets worse, not better.
The intuition: shading toward 50 percent buys you a smaller penalty when you are wrong, but it costs you more than that in the cases where you are right. The arithmetic of squaring makes the honest number the profitable one. This is the property that makes the Brier score worth using at all, and it is why forecasting tournaments have used it since the 1950s.
Saying 50 percent forever does protect you from ever scoring worse than 0.25. It also guarantees you never score better than 0.25, which means you never demonstrate anything.
Brier score or log score?
Both are proper scoring rules. The difference is how harshly they punish confident mistakes.
The Brier score squares the error, so the worst possible single forecast costs 1. The logarithmic score takes the negative log of the probability you assigned to what actually happened, so a forecast of 0 percent on something that happens costs infinity. Log scoring is more sensitive at the extremes and is preferred when the tails matter. Brier scoring is bounded, easier to average, and easier to explain, which is why tournaments and weather services still lean on it.
For most people the practical answer is: use Brier, and never write 0 or 100 percent.
What is a relative Brier score?
A relative Brier score is your score minus the score of a benchmark on the same questions, at the same moments. It is the only version of the number that answers "compared to what".
The benchmark can be a simple rule, such as the historical base rate, or another forecaster, or a market price. Allan Murphy showed in A New Vector Partition of the Probability Score, published in 1973, that a Brier score splits into three parts: how uncertain the events were in the first place, how well calibrated you were, and how much you separated the events that happened from the ones that did not. The first part belongs to the questions, not to you. Subtracting a benchmark is the cheap way to strip it out.
This matters for prediction markets specifically. Market prices are strong but not uniform. In a study of more than 2,500 political markets covering the final five weeks of the 2024 US presidential campaign, posted to SocArXiv on 1 December 2025, Joshua Clinton and TzuFeng Huang found that 93 percent of PredictIt markets predicted the outcome better than chance, against 78 percent on Kalshi and 67 percent on Polymarket. The bar you are clearing is different on different venues and different questions, which is the whole argument for scoring against the price rather than in the abstract.
How insiderz uses it
On insiderz, a call is a yes or no statement on a real event with a confidence attached. The call is locked the moment it is posted, with the time and the Polymarket price at that moment frozen alongside it. Nothing can be edited or deleted.
When the event resolves, the call is scored against that frozen price. The Edge column on the insiders leaderboard is the average of that comparison: how much better, or worse, a person's calls were than the market price they were up against. Beats market counts how often they came out ahead. The words Brier and relative Brier do not appear in the product, but that is the arithmetic underneath, and this article is where it belongs.
You can read the companion piece on calibration, which measures a different failure: whether the things you call 70 percent actually happen about 70 percent of the time. A good Brier score needs both calibration and the willingness to move away from 50 percent. If you want the evidence on how accurate market prices are before you try to beat them, start with are prediction markets accurate, and to see what a scored record looks like in practice, see how to find people who actually beat the market.
Questions people ask
- What is a Brier score?
- The average squared difference between the probability you gave and what actually happened, coded as 1 or 0. Zero is perfect, 0.25 is a coin flip, 1 is as wrong as possible.
- What is a good Brier score?
- It depends entirely on the question set, so a score without its question set means nothing. On the ForecastBench human question set, the superforecaster median was 0.096 overall and 0.074 on questions taken from prediction markets.
- Why is the Brier score called a proper scoring rule?
- Because your expected score is best when you report the probability you actually believe. Shading a number toward 50 percent to look safe makes your expected score worse, not better.
- Can you compare two Brier scores directly?
- Only if they come from the same questions. Easy questions produce low scores for everybody, so the fair comparison is against a benchmark on the same events, such as the market price at the moment each forecast was made.
- Is a lower Brier score always better?
- Lower is better on a fixed set of questions. Across different sets it is not comparable, because a forecaster who only answers near certain questions will score better than one who answers hard ones.
Sources
- Glenn W. Brier, Verification of Forecasts Expressed in Terms of Probability, Monthly Weather Review 78(1), American Meteorological Society, January 1950
- Allan H. Murphy, A New Vector Partition of the Probability Score, Journal of Applied Meteorology 12(4), American Meteorological Society, 1973
- Ezra Karger et al., ForecastBench: A Dynamic Benchmark of AI Forecasting Capabilities, ICLR 2025, arXiv, revised February 2025
- Barbara Mellers et al., Identifying and Cultivating Superforecasters as a Method of Improving Probabilistic Predictions, Perspectives on Psychological Science 10(3), 2015
- Joshua D. Clinton and TzuFeng Huang, Prediction Markets? The Accuracy and Efficiency of $2.4 Billion in the 2024 Presidential Election, SocArXiv preprint, 1 December 2025